Source Code
'~ This is file example_box_simple.bas
'~ Example source code for GooData graphic library.
'
'~ Licence: GPLv3
'~ (C) 2012 Thomas[ dot ]Freiherr[ at ]gmx[ dot ]net
'~ create the data
RANDOMIZE TIMER
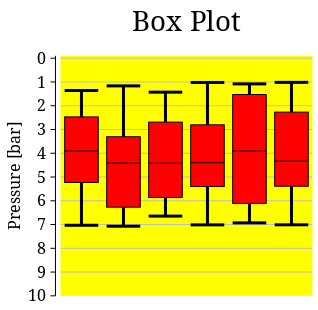
CONST cols = 5, rows = 30
DIM AS GooType datas(rows, cols)
FOR r AS INTEGER = 0 TO rows
FOR c AS INTEGER = 0 TO cols
datas(r, c) = RND() * 6.20 + 1
NEXT
NEXT
VAR Dat = goo_data_points_new(rows + 1, cols + 1, @datas(0, 0))
VAR wdth = 252.0, hght = 240.0, line_group = 1.0
'~ the group for all items
VAR group = goo_canvas_group_new(Glob, _
"line_width", line_group, _
NULL)
'~ the header text line
VAR title = goo_canvas_text_new(group, _
"<span size=""xx-large"">" _
"Box Plot" _
!"</span>\n", _
0.0, 0.0, wdth, GOO_CANVAS_ANCHOR_SW, _
"use_markup", TRUE, _
"alignment", PANGO_ALIGN_CENTER, _
NULL)
'~ the background item
VAR back = goo_canvas_rect_new(group, _
0.0, 0.0, wdth, hght, _
"fill_color", "yellow1", _
"stroke_pattern", NULL, _
NULL)
'~ an axis for scaling
VAR axis = goo_axis_new(group, back, GOO_GRIDAXIS_WEST, _
"Pressure [bar]", _
"range", "10 -0.1", _
"offset", "5", _
NULL)
'~ set the grid style
goo_axis_set_grid_properties(axis, _
"stroke_color", "grey", _
NULL)
'~ create the boxplot
VAR box = goo_box2d_new(group, axis, Dat, _
"channels", "0 1 2 3 4 5", _
"fill_color", "red", _
NULL)
'~ customize whisker style
goo_box2d_set_whiskers_properties(box, _
"line_width", line_group * 3, _
NULL)