Source Code
'~ This is file example_curve_portfolio.bas
'~ Example source code for GooData graphic library.
'
'~ Licence: GPLv3
'~ (C) 2012 Thomas[ dot ]Freiherr[ at ]gmx[ dot ]net
'~ create the data
CONST cols = 2
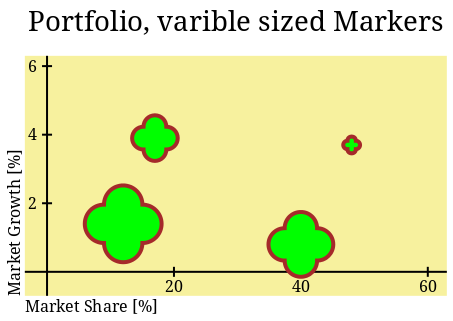
DIM AS GooType datas(..., cols) = { _
{17, 3.9, 38} ,_
{40, 0.8, 54} ,_
{48, 3.7, 14} ,_
{12, 1.4, 64} _
}
VAR Dat = goo_data_points_new(UBOUND(datas) + 1, cols + 1, @datas(0, 0))
VAR wdth = 422.0, hght = 240.0, line_group = 2.0
'~ the group for all items
VAR group = goo_canvas_group_new(Glob, _
"line_width", line_group, _
NULL)
'~ the header line
VAR title = goo_canvas_text_new(group, _
"<span size=""xx-large"">" _
"Portfolio, varible sized Markers" _
!"</span>\n", _
0.0, 0.0, wdth, GOO_CANVAS_ANCHOR_SW, _
"use_markup", TRUE, _
"alignment", PANGO_ALIGN_CENTER, _
NULL)
'~ the background item
VAR back = goo_canvas_rect_new(group, _
0.0, 0.0, wdth, hght, _
"fill_color", "#F7F19E", _
"stroke_pattern", NULL, _
NULL)
'~ X-axis
VAR xaxis = goo_axis_new(group, back, GOO_AXIS_SOUTH, "Market Share [%]", _
"label_align", PANGO_ALIGN_LEFT, _
"offset-along", -hght * 0.7 / (0.7 + 6.3), _
"range", "-3.5 63", _
"tick_length", "5 5", _
"ticks", "20 40 60", _
NULL)
'~ Y-axis
VAR yaxis = goo_axis_new(group, back, GOO_AXIS_WEST, "Market Growth [%]", _
"label_align", PANGO_ALIGN_LEFT, _
"offset-along", -wdth * 3.5 / (63 + 3.5), _
"offset_label", 5.0, _
"range", "-0.7 6.3", _
"ticks", "2 4 6", _
"tick_length", "5 5", _
NULL)
'~ a curve with variable sized markers, no line between the points
VAR curve = goo_curve2d_new(group, xaxis, yaxis, Dat, _
"channels", "0 1", _
"markers", "c 2 " & GOO_MARKER_FLOWER1 & " 1.2", _
"line_type", "none", _
NULL)
'~ set markers style
goo_curve2d_set_markers_properties(curve, _
"stroke_color", "brown", _
"fill_color", "green", _
NULL)