Source Code
'~ This is file example_pie_percent.bas
'~ Example source code for GooData graphic library.
'
'~ Licence: GPLv3
'~ (C) 2012 Thomas[ dot ]Freiherr[ at ]gmx[ dot ]net
'~ create the data
CONST cols = 5
DIM AS GooType datas(..., cols) = _
{ _
{0.1, 0.1 , 0.25, 0.4 , 0.0, 1.0 - GOO_EPS} _
, {0.3, 0.05, 0.7 , 0.05, 0.0, 0.0} _
, {0.6, 0.1 , 0.8 , 0.05, 0.0, 0.0} _
, {0.9, 0.05, 0.9 , 0.3 , 0.0, 0.0} _
}
VAR az = UBOUND(datas, 1)
VAR Dat = goo_data_points_new(az + 1, cols + 1, @datas(0, 0))
VAR wdth = 422.0, hght = 240.0, line_group = 2.0
'~ the group for all items
VAR group = goo_canvas_group_new(Glob, _
"line_width", line_group, _
NULL)
'~ the header line
VAR title = goo_canvas_text_new(group, _
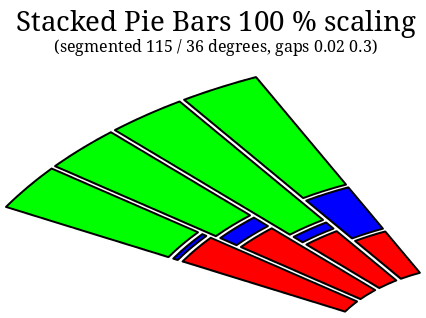
"<span size=""xx-large"">" _
"Stacked Pie Bars 100 % scaling" _
"</span>" _
!"\n(segmented 115 / 36 degrees, gaps 0.02 0.3)\n", _
0.0, 0.0, wdth, GOO_CANVAS_ANCHOR_SW, _
"use_markup", TRUE, _
"alignment", PANGO_ALIGN_CENTER, _
NULL)
'~ the pie chart
var grid = goo_pie2d_new(group, Dat, 0.0, 0.0, wdth, hght, _
"channels", "Percent 0 1 2", _
"segmented", "115 36", _
"gaps", "0.02 0.3", _
NULL)