| GooData Reference Manual |
|---|
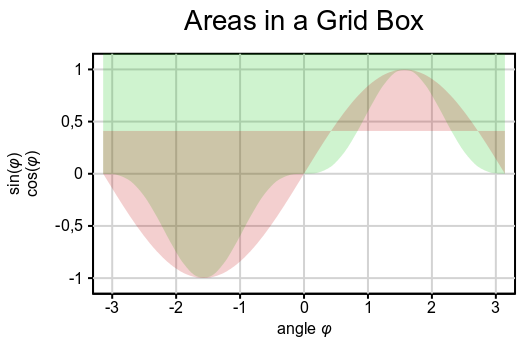
ExampleExample: Simple Line Graph — how to create a simple rectangle line graph. |
Here's a complete example application that creates a #GooCanvas with a rectangle graph and two curves in it. The curves are drawn with areas to the Y-value 0.0 (zero)). Due to transparency (alpha < 255) the cross section is high-lighted.
#include <math.h>
#include <goodata.h>

int
main (int argc, char *argv[])
{
  GtkWidget *window, *scrolled_win, *canvas;
  GooCanvasItem *root, *group, *title, *grid, *x, *y, *c1, c2;

  /* Initialize GTK+. */
  gtk_init (&argc, &argv);

  /* Create the window and widgets. */
  window = gtk_window_new (GTK_WINDOW_TOPLEVEL);
  gtk_window_set_default_size (GTK_WINDOW (window), 640, 600);
  gtk_widget_show (window);
  g_signal_connect (window, "delete_event", (GtkSignalFunc) on_delete_event,
                    NULL);

  scrolled_win = gtk_scrolled_window_new (NULL, NULL);
  gtk_scrolled_window_set_shadow_type (GTK_SCROLLED_WINDOW (scrolled_win),
                                       GTK_SHADOW_IN);
  gtk_widget_show (scrolled_win);
  gtk_container_add (GTK_CONTAINER (window), scrolled_win);

  canvas = goo_canvas_new ();
  gtk_widget_set_size_request (canvas, 600, 450);
  goo_canvas_set_bounds (GOO_CANVAS (canvas), 0, 0, 1000, 1000);
  gtk_widget_show (canvas);
  gtk_container_add (GTK_CONTAINER (scrolled_win), canvas);

  root = goo_canvas_get_root_item (GOO_CANVAS (canvas));

  /* ********************************* */
  /* ***** Start of GooData code ***** */
  /* ********************************* */

  /* Generate data */
  int values = 31;
  gdouble Dat[values][3], vx, vy;
  for(int i = 0; i < values; i++)
    {
      vx = G_PI * (2 * i / (values - 1) - 1);
      vy = sin(vx);
      Dat[i][0] = vx;
      Dat[i][1] = vy * vy * vy;
      Dat[i][2] = vy;
    }

  /* Create a GooCanvasGroup for the grapgh */
  group = goo_canvas_group_new (Glob,
          "line_width", 1.0,
          "font", "Arial",
           NULL);

  /* Add a text for the title */
  title = goo_canvas_text_new (group,
          "<span size=\"xx-large\">"
          "Areas in a Grid Box"
          "</span>\n",
           0.0, 0.0, 400.0, GOO_CANVAS_ANCHOR_SW,
          "use_markup", TRUE,
          "alignment", PANGO_ALIGN_CENTER,
           NULL);

  /* Add a rectangle as background */
  grid = goo_canvas_rect_new (group,
           0.0, 0.0, 400.0, 300.0,
           NULL);

  /* Add an X-axis with a grid */
  x = goo_axis_new (group, grid, "angle <i>φ</i>", GOO_GRIDAXIS_SOUTH,
          "borders", "-3.3 3.3",
          "ticks", "1",
           NULL);

  /* Set the X-grid color */
  goo_axis_set_grid_properties (x,
          "stroke_color", "lightgray",
           NULL);

  /* Add an Y-axis with a grid */
  y = goo_axis_new (group, grid, "<span color=\"green\">sin <i>φ</i></span> "
          "<span color=\"red\">sin³ <i>φ</i></span>", GOO_GRIDAXIS_WEST,
          "text_offset", 7.,
          "borders", "-1.15 1.15",
          "ticks", ".5",
           NULL);

  /* Set the Y-grid color */
  goo_axis_set_grid_properties (y,
          "stroke_color", "lightgray",
           NULL);

  /* Add a curve with area, channels 0 and 2 */
  c1 = goo_curve_new (group, x, y, Dat,
          "channels", "0 2",
          "stroke_color", "green",
          "area", "Y0",
           NULL);

  /* Set the area fill color */
  goo_curve_set_area_properties (c1,
          "fill-color-rgba", 0x00C00030,
           NULL);

  /* Add a curve with area, channels 0 and 1 */
  c2 = goo_curve_new (group, x, y, Dat,
          "fill_color", "lightred",
          "stroke_color", "red",
          "area", "Y0",
           NULL);

  /* Set the area fill color */
  goo_curve_set_area_properties (c2,
          "fill-color-rgba", 0xC0000030,
           NULL);

  /* ********************************* */
  /* *****  End of GooData code  ***** */
  /* ********************************* */

  /* Move the group to the final position */
  goo_canvas_item_translate(group, 40.0, 90.0);

  /* Pass control to the GTK+ main event loop. */
  gtk_main ();

  return 0;
}
And here's the same example code in FreeBasic syntax
'~This is file example_complete.bas
'
'~Licence: GPLv3
'~(C) 2012 Thomas[ dot ]Freiherr[ at ]gmx[ dot ]net

#INCLUDE ONCE "goodata.bi"

'~ initialize GTK+.
gtk_init (@__FB_ARGC__, @__FB_ARGV__)

'~ create the window
VAR window = gtk_window_new (GTK_WINDOW_TOPLEVEL)
gtk_window_set_default_size (GTK_WINDOW (window), 640, 600)
gtk_widget_show (window)
g_signal_connect (window, "delete_event", (GtkSignalFunc) on_delete_event, _
                  NULL)

'~ create a scrolable container
VAR scrolled_win = gtk_scrolled_window_new (NULL, NULL)
gtk_scrolled_window_set_shadow_type (GTK_SCROLLED_WINDOW (scrolled_win), _
                                     GTK_SHADOW_IN)
gtk_widget_show (scrolled_win)
gtk_container_add (GTK_CONTAINER (window), scrolled_win)

'~ create the GooCanvas
VAR canvas = goo_canvas_new ()
gtk_widget_set_size_request (canvas, 600, 450)
goo_canvas_set_bounds(GOO_CANVAS (canvas), 0, 0, 1000, 1000)
gtk_widget_show (canvas)
gtk_container_add(GTK_CONTAINER (scrolled_win), canvas)

'~ get the root item
VAR root = goo_canvas_get_root_item (GOO_CANVAS (canvas))

' *********************************
' ***** Start of GooData code *****
' *********************************


CONST cols = 2, az = 30, l = 4 * ATN(1), line_group = 2.0
DIM AS GooType datas(az, cols)
FOR i AS INTEGER = 0 TO az
  VAR x = -l + i / az * 2 * l
  datas(i, 0) = x
  datas(i, 1) = SIN(x)
  datas(i, 2) = SIN(x) ^ 3
NEXT
VAR Dat = goo_data_points_new(az + 1, cols + 1, @datas(0, 0))
VAR wdth = 422.0, hght = 240.0

VAR group = goo_canvas_group_new(Glob, _
            "line_width", 2.0, _
            "font", "Arial", _
            NULL)

VAR title = goo_canvas_text_new(group, _
            "<span size=""xx-large"">"_
            "Areas in a Grid Box" _
           !"</span>\n", _
            0.0, 0.0, wdth, GOO_CANVAS_ANCHOR_SW, _
            "use_markup", TRUE, _
            "alignment", PANGO_ALIGN_CENTER, _
            NULL)

VAR grid = goo_canvas_rect_new(group, _
            0.0, 0.0, wdth, hght, _
            NULL)

VAR xaxis = goo_axis_new(group, grid, GOO_GRIDAXIS_SOUTH, _
            "angle <i>φ</i>", _
            "range", "-3.3 3.3", _
            "ticks", "1", _
            NULL)

goo_axis_set_grid_properties(xaxis, _
            "stroke_color", "lightgray", _
            NULL)

VAR yaxis = goo_axis_new(group, grid, GOO_GRIDAXIS_WEST, _
           !"sin(<i>φ</i>)\ncos(<i>φ</i>)", _
            "offset_label", 7., _
            "range", "-1.15 1.15", _
            "ticks", ".5", _
            NULL)

goo_axis_set_grid_properties(yaxis, _
            "stroke_color", "lightgray", _
            NULL)

VAR curve1 = goo_curve2d_new(group, xaxis, yaxis, Dat, _
            "channels", "0 2", _
            "line-type", "none", _
            "stroke_color", "green", _
            "area-direction", "north", _
            "area_linetype", "bezier 0.6", _
            NULL)

goo_curve2d_set_area_properties(curve1, _
            "fill-color-rgba", &h00C00030, _
            NULL)

VAR curve2 = goo_curve2d_new(group, xaxis, yaxis, Dat, _
            "channels", "0 1", _
            "fill_color", "lightred", _
            "line_type", "none", _
_            "stroke_color", "red", _
_            "area", "Y0", _
            "area_linetype", "bezier 0.6", _
            "area_direction", "y0.41", _
            NULL)

goo_curve2d_set_area_properties(curve2, _
            "fill-color-rgba", &hC0000030, _
            NULL)

' *********************************
' *****  End of GooData code  *****
' *********************************

'~ move the group to the final position
goo_canvas_item_translate (group, 40.0, 90.0)

'~ pass control to the GTK+ main event loop.
gtk_main()
As you can see there're very little differences between the two syntaxes. It's easier to read the FreeBasic Syntax so further examples will be shown in this language. Find more examples in the chapter Examples (or by clicking on the images in the Gallery ). Just remove the GooData code and replace it by the new one.