Source Code
'~ This is file example_simplecurve.bas
'~ Example source code for GooData graphic library.
'
'~ Licence: GPLv3
'~ (C) 2012 Thomas[ dot ]Freiherr[ at ]gmx[ dot ]net
'~ create the data
RANDOMIZE TIMER
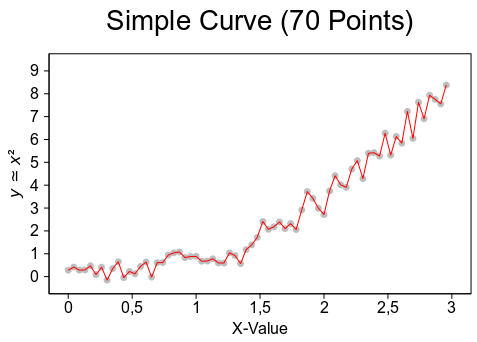
CONST cols = 1, az = 69, l = 3, line_group = 1.0
DIM AS GooType datas(az, cols)
FOR i AS INTEGER = 0 TO az
VAR a = i / az * l
datas(i, 0) = a
a *= a
datas(i, 1) = a + RND() * COS(a * a) - .5
NEXT
VAR Dat = goo_data_points_new(az + 1, cols + 1, @datas(0, 0))
VAR wdth = 422.0, hght = 240.0
'~ the group for all items
VAR group = goo_canvas_group_new(Glob, _
"line_width", line_group, _
"font", "Arial", _
NULL)
'~ the header line
VAR title = goo_canvas_text_new(group, _
"<span size=""xx-large"">" _
"Simple Curve (" & az + 1 & " Points)" _
!"</span>\n", _
0.0, 0.0, wdth, GOO_CANVAS_ANCHOR_SW, _
"use_markup", TRUE, _
"alignment", PANGO_ALIGN_CENTER, _
NULL)
'~ the background item
VAR back = goo_canvas_rect_new(group, _
0.0, 0.0, wdth, hght, _
NULL)
'~ X-axis
VAR xaxis = goo_axis_new(group, back, GOO_AXIS_SOUTH, _
"X-Value", _
"range", "-0.15 3.15", _
"ticks", "0.5", _
NULL)
'~ gray grid lines for X-axis
goo_axis_set_grid_properties(xaxis, _
"stroke_color", "lightgray", _
NULL)
'~ Y-axis
VAR yaxis = goo_axis_new(group, back, GOO_AXIS_WEST, _
!"𝘺 ≃ 𝘹²", _
"offset_label", 7., _
"range", "-0.75 9.75", _
"ticks", "1", _
NULL)
'~ gray grid lines for Y-axis
goo_axis_set_grid_properties(yaxis, _
"stroke_color", "lightgray", _
NULL)
'~ a line dash with 0.0 and a big gap to draw points only
VAR dash = goo_canvas_line_dash_new(2, 0.0, wdth * hght)
'~ round points
VAR c1 = goo_simplecurve2d_new(group, xaxis, yaxis, Dat, 0, 1, _
"stroke_color", "gray", _
"line_width", line_group * 7, _
"line_cap", CAIRO_LINE_CAP_ROUND, _
"line_dash", dash, _
NULL)
'~ a second line on top
VAR c2 = goo_simplecurve2d_new(group, xaxis, yaxis, Dat, 0, 1, _
"stroke_color", "red", _
"line_width", line_group, _
"line_join", CAIRO_LINE_JOIN_ROUND, _
NULL)