Source Code
'~ This is file example_curve_areas.bas
'~ Example source code for GooData graphic library.
'
'~ Licence: GPLv3
'~ (C) 2012 Thomas[ dot ]Freiherr[ at ]gmx[ dot ]net
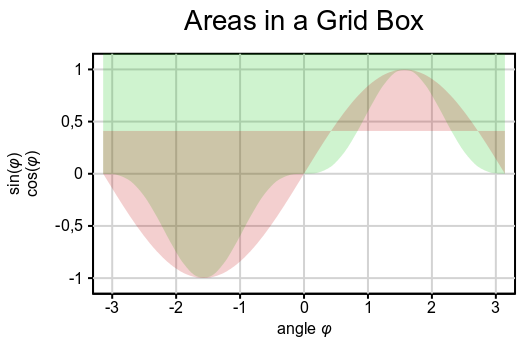
CONST cols = 2, az = 30, l = 4 * ATN(1), line_group = 2.0
DIM AS GooType datas(az, cols)
FOR i AS INTEGER = 0 TO az
VAR x = -l + i / az * 2 * l
datas(i, 0) = x
datas(i, 1) = SIN(x)
datas(i, 2) = SIN(x) ^ 3
NEXT
VAR Dat = goo_data_points_new(az + 1, cols + 1, @datas(0, 0))
VAR wdth = 422.0, hght = 240.0
VAR group = goo_canvas_group_new(Glob, _
"line_width", 2.0, _
"font", "Arial", _
NULL)
VAR title = goo_canvas_text_new(group, _
"<span size=""xx-large"">"_
"Areas in a Grid Box" _
!"</span>\n", _
0.0, 0.0, wdth, GOO_CANVAS_ANCHOR_SW, _
"use_markup", TRUE, _
"alignment", PANGO_ALIGN_CENTER, _
NULL)
VAR grid = goo_canvas_rect_new(group, _
0.0, 0.0, wdth, hght, _
NULL)
VAR xaxis = goo_axis_new(group, grid, GOO_GRIDAXIS_SOUTH, _
"angle <i>φ</i>", _
"range", "-3.3 3.3", _
"ticks", "1", _
NULL)
goo_axis_set_grid_properties(xaxis, _
"stroke_color", "lightgray", _
NULL)
VAR yaxis = goo_axis_new(group, grid, GOO_GRIDAXIS_WEST, _
!"sin(<i>φ</i>)\ncos(<i>φ</i>)", _
"offset_label", 7., _
"range", "-1.15 1.15", _
"ticks", ".5", _
NULL)
goo_axis_set_grid_properties(yaxis, _
"stroke_color", "lightgray", _
NULL)
VAR curve1 = goo_curve2d_new(group, xaxis, yaxis, Dat, _
"channels", "0 2", _
"line-type", "none", _
"stroke_color", "green", _
"area-direction", "north", _
"area_linetype", "bezier 0.6", _
NULL)
goo_curve2d_set_area_properties(curve1, _
"fill-color-rgba", &h00C00030, _
NULL)
VAR curve2 = goo_curve2d_new(group, xaxis, yaxis, Dat, _
"channels", "0 1", _
"fill_color", "lightred", _
"line_type", "none", _
_ "stroke_color", "red", _
_ "area", "Y0", _
"area_linetype", "bezier 0.6", _
"area_direction", "y0.41", _
NULL)
goo_curve2d_set_area_properties(curve2, _
"fill-color-rgba", &hC0000030, _
NULL)