Source Code
'~ This is file example_curve_perpens.bas
'~ Example source code for GooData graphic library.
'
'~ Licence: GPLv3
'~ (C) 2012 Thomas[ dot ]Freiherr[ at ]gmx[ dot ]net
CONST cols = 2, az = 30, l = 4 * ATN(1)
DIM AS GooType datas(az, cols)
FOR i AS INTEGER = 0 TO az
VAR x = -l + i / az * 2 * l
datas(i, 0) = x
datas(i, 1) = SIN(x)
datas(i, 2) = SIN(x) ^ 3
NEXT
VAR Dat = goo_data_points_new(az + 1, cols + 1, @datas(0, 0))
VAR wdth = 422.0, hght = 240.0, line_group = 2.0
VAR group = goo_canvas_group_new(Glob, _
"line_width", line_group, _
NULL)
VAR title = goo_canvas_text_new(group, _
!"<span size=\"xx-large\">"_
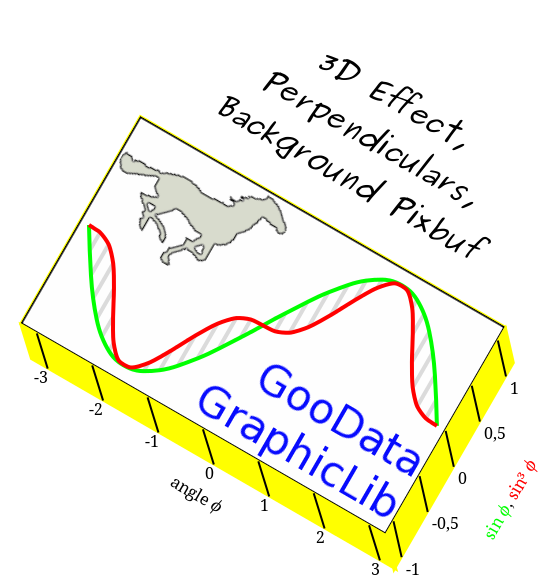
"3D Effect, Perpendiculars, Background Pixbuf" _
!"</span>\n", _
0.0, 0.0, wdth, GOO_CANVAS_ANCHOR_SW, _
"font", "Purisa Bold Italic", _
"use_markup", TRUE, _
"alignment", PANGO_ALIGN_CENTER, _
NULL)
VAR grid = goo_canvas_rect_new(group, _
0.0, 0.0, wdth, hght, _
"stroke_color", "yellow", _
"fill_color", "lightyellow", _
"line_width", line_group, _
NULL)
VAR pixbuf = gdk_pixbuf_new_from_file("background.png", 0)
VAR image = goo_canvas_image_new(group, _
pixbuf, _
0.0, 0.0, _
"width", wdth, _
"height", hght, _
"scale_to_fit", TRUE, _
NULL)
VAR x = goo_axis_new(group, grid, GOO_AXIS_SOUTH, _
"angle <i>φ</i>", _
"stroke_color", "yellow", _
"fill_color", "yellow", _
"offset", "25 -27", _
"range", "-3.3 3.3", _
"tick_length", "0.01", _
"angle_ticklabel", 30.0, _
"ticks", "1", _
NULL)
goo_axis_set_ticks_properties(x, _
"stroke_color", "black", _
NULL)
goo_axis_set_text_properties(x, _
"fill_color", "black", _
NULL)
VAR y = goo_axis_new(group, grid, GOO_AXIS_EAST, _
!"<span color=\"green\">sin <i>φ</i></span>, " _
!"<span color=\"red\">sin³ <i>φ</i></span>", _
"stroke_color", "yellow", _
"fill_color", "yellow", _
"offset", "25 -27", _
"offset_label", 7., _
"range", "-1.15 1.15", _
"ticks", ".5", _
"tick_length", "0.01", _
"angle_ticklabel", 30.0, _
NULL)
goo_axis_set_ticks_properties(y, _
"stroke_color", "black", _
NULL)
goo_axis_set_text_properties(y, _
"fill_color", "black", _
NULL)
VAR c1 = goo_curve2d_new(group, x, y, Dat, _
"channels", "0 1", _
"line_type", "bezier", _
"stroke_color", "green", _
"perpendiculars", "V2", _
NULL)
goo_curve2d_set_perpens_properties(c1, _
"stroke_color_rgba", &hC0C0C090, _
NULL)
VAR c2 = goo_curve2d_new(group, x, y, Dat, _
"channels", "0 2", _
"line_type", "bezier 0.5", _
"stroke_color", "red", _
NULL)
goo_canvas_item_set_simple_transform(group, wdth / 2, hght / 2, 1.0, 30.0)