The best way to learn a new library API is to test out some examples. A working example shows that the installation of the library components is OK. And by adapting the example source code you can most efficiently find out if your understanding of the documentation matches reality.
So libpruio ships with a bunch of example codes. All of them have less than 200 lines of code, and most of them are available in FreeBASIC, Python and in C syntax. Just a few examples generate grafical output and are available in FreeBASIC systax only.
In order to work and show the desired effect, some examples need pinmuxing configuration on your system, see section Pinmuxing for details. Others need custom wiring on the header pins. Therefor a minimal knowlege on electronics is required to avoid damaging your Beaglebone board when doing the wiring. Avoid electrostatic charging and connect the wires only when the Beaglebone board is switched off. The circuits are designed for minimal hardware requirements, so you need not spend a lot of money for testing.
If you don't like to compile source code on your box, you can also install the libpruio-bin package (see section Debian Packages) and run pre-compiled binaries instead.
sudo (even in case of pinmuxing requirements). You may need to prepend sudo when you don't use the LKM pinmuxing as a member of group pruio, see section Pinmuxing for details.# include "[...]/pruio_pins.[h|bi]" -> # include "[...]/pruio_pins_pocket.[h|bi]") and adapt the pin numbers (ie. P8_11 -> P2_33).Here's an overview of all shipped examples
| Name | Type | Description | src/examples | src/c_examples | src/python | libpruio-bin |
|---|---|---|---|---|---|---|
| Simple (1) | IO:T | Simple ADC input | 1.bas | 1.c | 1.py | pruio_1 |
| analyse | IO:T | Output system config | analyse.bas | pruio_analyse | ||
| button | IO:T W | Simple Button | button.bas | button.c | button.py | pruio_button |
| button | IO:TPW | Simple Button invers | button2.bas | button2.c | button2.py | pruio_button2 |
| io_input | IO:T | GPIO/ADC input | io_input.bas | io_input.c | io_input.py | pruio_io_input |
| performance | IO:TPW | Pin toggling tests | performance.bas | performance.c | performance.py | pruio_performance |
| pwm_cap | IO:TPW | CAP/PWM input/output | pwm_cap.bas | pwm_cap.c | pwm_cap.py | pruio_pwm_cap |
| pruss_add | T | PRUSS firmware | pruss_add.bas | pruss_add.c | pruss_add.py | pruio_pruss_add |
| pruss_toggle | IO:TPW | GPIO->CAP with PRUSS | pruss_toggle.bas | pruss_toggle.c | pruss_toggle.py | pruio_pruss_toggle |
| qep | IO:TPW | QEP input | qep.bas | qep.c | qep.py | pruio_qep |
| rb_file | RB:T | Fast ADC file output | rb_file.bas | rb_file.c | rb_file.py | pruio_rb_file |
| sos | IO:T | User LED access | sos.bas | sos.c | sos.py | pruio_sos |
| stepper | IO:TPW | Uni-P stepper motor | stepper.bas | stepper.c | stepper.py | pruio_stepper |
| pwm_adc | IO:GPW | Compare PWM outputs | pwm_adc.bas | pruio_pwm_adc | ||
| oszi | IO:G | IO ADC input grafic | oszi.bas | pruio_oszi | ||
| rb_oszi | RB:G | RB ADC input grafic | rb_oszi.bas | pruio_rb_oszi | ||
| triggers | MM:G W | RB ADC input grafic | triggers.bas | pruio_triggers |
Type: IO: = running in IO mode, RB: = running in RB mode, MM: = running in MM mode, T = Text output, G = Graphic output, P = Pinmuxing required, W = Wiring required.
The examples in this section all produce console text output. The source code is available in FreeBASIC (folder src/examples), Python (folder src/python) and C (folder src/c_examples) syntax. The output between the versions may vary a bit, in order to keep the examples informative, but the C example code simple.
Description:
This is a minimal example printing a table of some analog samples from the ADC subsystem. It illustrates the principle usage of libpruio described in section Operation by a minimal number of code lines.
Preparation:
No preparation is required. Optionaly you can connect the analog ground at P9_34 (AGND) and some of the analog input lines AIN-0 to AIN-6 to a voltage source in the range of 0 V to 1V8 (ie. from a battery).
Operation:
Start the program in the terminal by typing ./1 and press the Return key. The output is a table containing 13 lines of all analog inputs. It looks like
The last column (AIN-7) is the on board voltage divided by 2 (&hEE50 / &hFFF0 * 1V8 = 1V67 V). The fifth column is channel AIN-4, which is connected to ground (P9_34 = AGND) during the test. The other channels are open ended.
Source Code:
Description:
This example shows how to read the subsystem configurations. It creates a PruIo instance and prints out all startup registers context (Init).
Preparation:
No preparation is required.
Operation:
Start the program in the terminal by typing ./analyse and press the Return key. The output is a long list of text lines, like
First, all header pin configurations are shown. Then the registers of the GPIO subsystems (0 to 3) get listed, followed by the ADC subsystem registers, the registers of the PWMSS subsystems (0 to 2) and the TIMER subsystems (4 to 7). It's the context of the structures named ???Set (ie. BallSet, GpioSet, AdcSet, PwmssSet and TimerSet). The output may be helpful for debugging purposes in your projects.
Source Code:
No Python nor C source available
Description:
This example shows how to get input from a digital line. It creates a new PruIo instance configured in IO mode, which continuously prints out the state of a single digital inout line.
Preparation:
The code uses header pin P8_07, which is configured as GPIO input with pullup resistor by default. We use this standard configuration (no pinmuxing required) and ground the pin by a button to see some changes. Here's the wiring diagram
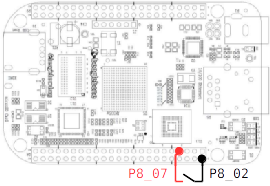
Operation:
Start the program by executing ./button and you'll see a new line containing a continuously updated single number. 1 gets shown when the button is open, and 0 (zero) when the button is closed. Press any key on your keyboard to end the program.
Source Code:
Description:
This example shows how to get input from digital and analog subsystems. It creates a new PruIo instance configured in IO mode and prints out continuously the state of all the GPIO and ADC lines. GPIO data gets read from the raw data (all bits from a subsystem by a single operation).
Preparation:
No preparation is required. Optionaly you can connect the analog ground P9_34 (AGND) and some of the analog input lines AIN-0 to AIN-6 to a voltage source in the range of 0 to 1V8 (ie. from a battery).
Operation:
Start the program by executing ./io_input and you'll see continuously updated output like (FB version)
The first line is a scale (or rule) to support identifying the bit positions. The next four lines show the state of the GPIO subsystems 0 to 3 (1 = high, 0 = low). The last line is the sampled ADC data form AIN 0 to 7 as hexadecimal values in 16 bit encoding.
You can watch the heartbeat (user LED 0) in the third line (GPIO-1, bit 21). The last analog value (AIN-7) is the measured voltage on the board (it should be the half of 3V3. here we have &hEE60 / &hFFF0 * 1V8 = 1V676).
To end the program press any key.
The C version outputs all in one line like (make sure to use a wide console window)
The first four columns are hexadecimal values of the GPIO subsystem states and the following columns are the ADC lines as in the FB version.
Source Code:
Description:
This file contains an example on measuring the execution speed of different controllers that toggles a GPIO output. It measures the frequency of the toggled GPIO output from open and closed loop controllers and compares their execution speed agains each other.
The code performs 50 tests of each controller version and computes the toggling frequencies Minimum, Avarage and Maximum in Hz at the end. The controllers are classified by
Preparation:
Pinmuxing is required for this example, since the used pins are in GPIO mode by default. So make sure that you accordingly prepared your system, see chapter Pinmuxing for details.
These are the used pins
| Pin | Function | Description |
|---|---|---|
| P8_16 | output | Common controller GPIO output |
| P8_14 | input | GPIO input for closed loop control |
| P9_42 | input | CAP input to measure the frequency |
| P9_39 | input | Analog input for closed loop control |
The common controller output gets connected to all inputs. The analog input is protected by a voltage divider to avoid overvoltage. A 47 k variable resistor in middle position was used for the tests.
Here's the wiring diagram
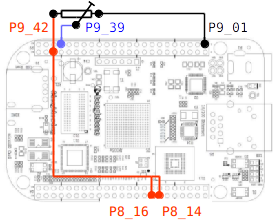
Operation:
Start the program by ./performance and you'll see a bunch of lines like
which shows the measured frequencies of the different controllers in a single test. After 50 lines of test results, the subsumtion gets shown like
All values are measured frequencies of the toggled output in Hz. Since the controller performs two steps to toggle the output, the controller frequency is twice the measured toggle frequency. The differences between Minimum and Maximum are due to the load of the host (ARM) CPU, which sometimes has to execute interrupts (ie. keyboard, mouse, network, ...).
While FreeBASIC and C compiler code is similar in speed (as shown in table above), the Python interpreter executes about ten times slower than the compiled code.
Source Code:
Description:
This examples demonstrates how to perform pulse width modulated (PWM) output and how to measure such a pulse train (CAP = Capture and Analyse a Pulsetrain) with libpruio. The code creates a PruIo instance configured in IO mode. One header pin (P9_21) gets configured as PWM output and an other (P9_42) as CAP input. When both pins get connected, the measured pulse train data get shown in a continuously updated line. You can adapt the output and watch the input changing.
Preparation:
Pinmuxing is required for this example, since the used pins are in GPIO mode by default. So make sure that you accordingly prepared your system, see chapter Pinmuxing for details.
Here's the wiring diagram
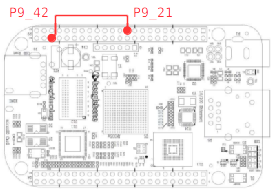
Operation:
Start the program by ./pwm_cap and you'll see a single continuously updated new line
which shows the measured frequency and duty cycle on the input pin, comming from the output pin. You can adapt the output by the following keystrokes.
To change the duty cycle, use
| Key | Duty |
|---|---|
| 0 | 0 % |
| 1 | 10 % |
| 2 | 20 % |
| 3 | 30 % |
| 4 | 40 % |
| 5 | 50 % |
| 6 | 60 % |
| 7 | 70 % |
| 8 | 80 % |
| 9 | 90 % |
| , | 100 % |
| . | 100 % |
To change the frequency (in the range of 0.5 Hz to 1 kHz), use
| Key | Function |
|---|---|
| + | set maximum frequency 1 000 000 Hz |
| - | set manimum frequency 0.5 Hz |
| * | multiply frequency by 2 (double) |
| / | divide frequency by 2 (half) |
| m | decrease frequency by 5 (minus) |
| p | increase frequency by 5 (plus) |
Any other key quits the program.
Each keystroke results in two new lines, one for the demands and the second is continuously updated with the measured stuff. Ie. when the duty cycle gets changed to 30 %, you'll see
There may be some difference between the demand and the measured values due to hardware limitations, which should be small in the middle of the possible frequency range and grows when you come to the upper or lower edge. When you switch to 100 % (always high) or 0 % (always low), there's no pulse train anymore and the frequency gets shown as 0 (zero). The CAP minimal frequency is set to 2 Hz, so after 0.5 seconds the measured values jump to 0 Hz / 0 %. Any output frequency below 2 Hz also results in measured 0 Hz / 0 %. And in case of 2 Hz output the measured value jumps between
and
Source Code:
Description:
This examples demonstrates how to load and run firmware on a PRU by libpruio functions. The firmware multiplies two numbers and adds the result to a start value. The code demonstrates how to
The libpruio PRUSS mainloop is not running (no call to PruIo::config() ), just the other PRUSS executes the loaded firmware.
Preparation:
No pinmuxing nor wiring is required for this example.
Operation:
Start the program by ./pruss_add and you should see console output like
Source Code:
Description:
This examples demonstrates how to load and run firmware on a PRU by libpruio functions. The firmware toggles a GPIO output pin at high speed and the libpruio CAP feature is used to measure the pulse train frequency. The code demonstrates how to
Preparation:
Pinmuxing is required for this example, since the output from the PRU-GPIO should get measured by the CAP input. Therefor use a simple wire to connect pin P8_11 (GPIO output) to P9_42 (CAP input).
Here's the wiring diagram
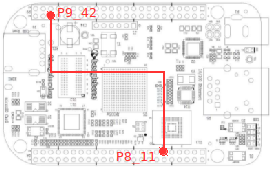
Operation:
Start the program by ./pruss_toggle and you should see console output like
The CAP counter works at 100 MHz, so 50 MHz is the maximum frequency. In contrast the PRUSS are clocked at 200 MHz and toggle at that speed, so a pulse train of 100 MHz is maximum - twice the maximum CAP frequency. Therefor the firmware toggling loop contains some NOOP instructions, in order to reduce the pulse train frequency. One toggle and four NOOP instructions are used, so toggling frequency is 40 MHz = 200 MHz / (1 + 4), which results in a pulse train of 20 MHz. The CAP counter runs up to 5 each time (20 MHz = 100 MHz / 5), and the intermediate pin toggling happens at counter values of 2 or 3, leading in random duty values of either 40 % or 60 %.
Source Code:
Description:
This example shows how to analyse input from a Quadrature encoder that is connected to some header pins. It creates a PruIo instance configured in IO mode and reads input (digital pulse trains) from up to three header pins, see QEP for details on QEP feature. Either a real encoder can get connected to the input pins, or the encoder signals can get simulated by PWM output. In the example, the frequency measurement is running at 25 Hz update rate.
Preparation:
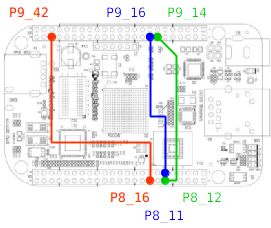
If you have a Quadrature encoder (ie. an old ball driven computer mouse) then make sure that the high output doesn't exeed 3V3 and connect the A and B signals to header pins P8_12 and P8_11. If the encoder generates an index signal, connect this to P8_16.
When you don't have a Quadrature encoder, then use the signal simulation included in the example. The code uses PWM output on pins P9_14 and P9_16 to simulate the A and B input. Both signals get generated with a duty cycle of 50 % and a phase shift of 1 / 4 by the PWM module of PWMSS-1, running in symetrical up-down mode. Additionaly the CAP module of PWMSS-0 is used to generate a short impulse to simulate the index event on pin P9_42 every two seconds (0.5 Hz). Here's the wiring diagram
Operation:
Start the program by ./qep and when a real sensor is connected, you should see console output like
When you connected a real sensor, then ignore the first line "PWM ...". The second line shows continuously the computed results, the position (first hexadecimal number) and the speed (second real number). When you move the sensor, both values should change depending on the sensor movement. On startup just one sensor signal (A input on pin P8_12) is used. The position counter is running in upwards direction and the speed value is always positive. You can change the QEP module configuration
| Key | Description |
|---|---|
| A | use A input (only speed information, positive direction) |
| B | use A and B input (position, speed and direction) |
| I | use A, B and Index input (position, speed and direction) |
| 0 | set PMax to 0 (=&h7FFFFFFF) |
| 1 | set PMax to 1024 |
| 4 | set PMax to 4096 |
| 5 | set PMax to 512 |
| 8 | set PMax to 8191 |
Each keystroke outputs a header line showing the new configuration. Using a real sensor, only the input part and PMax parts are of interest.
In contrast, when you start the program with sensor simulation connected (as shown in the above circuit), you'll see console output like
The position counter is running in upward direction and the speed value is constant. It's the double frequency in case of A input (and four times the frequency when you switch to A and B input by pressing key 'B').
You can change the simulated sensor output
| Key | Description |
|---|---|
| * | double the frequency (speed) |
| / | half the frequency (speed) |
| p | add 5 Hz to the frequency (speed) |
| m | subtract 5 Hz from the frequency (speed) |
| + | generate positive direction output |
| - | generate negative direction output |
The frequency of the simulated sensor gets shown in the header line as demand value and as real value in brackets. The frequency is limited to the range of 25 Hz to 500 kHz.
Source Code:
Description:
This file contains an example on how to use the ring buffer mode of libpruio. A fixed step mask of AIN-0, AIN-1 and AIN-2 get configured for maximum speed, sampled in to the ring buffer and from there saved as raw data to some files.
Preparation:
No preparation is required. Optionaly you can customize the number of samples, the sampling rate or the number of samples in the source code and recompile your version.
Operation:
Start the program by ./rb_file and you'll see console output like
The program created two new files in the current folder, named output.0 and output.1. The files contain the raw data from the three ADC channels AIN-0 to AIN-2.
Source Code:
Description:
This example shows how to control a GPIO output that is not connected to header pin (internal user LED in this case). It creates a PruIo instance configured in IO mode and controls the user LED-3, which is placed near the ethernet connector.
Preparation:
No preparation required.
Operation:
Start the program by ./sos and you'll see user LED-3 blinking in SOS code (short, short, short - long, long, long - short, short, short). The output looks like:
The blinking code may get disturbed by the system (kernel), which is also blinking the LED on mmc1 interrupts. Execute the mentioned command to get rid of this interferences. (Replace 'none' by 'mmc1' to restore the original configuration.)
Press any key to quit the program.
Source Code:
Description:
This example shows how to control a unipolar stepper motor by libpruio. It creates a PruIo instance configured in IO mode and prepares four GPIO lines as output. You can change motor direction and speed, stop the motor and switch of all pins.
Preparation:
This example can run without any hardware preparation, but you can watch only some text output changing in the console window. It's better to prepare a simple stepper motor setting to see a shaft turning. The hardware (motor and driver board) is available as a set in good electronics stores (ie. search for ULN2003 stepper set).
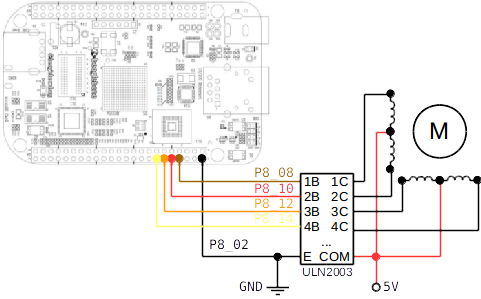
First, the header pins (P8_08, P8_10, P8_12 and P8_14) need to get configured as GPIO output pins, so you'll have to prepare your system for pinmuxing capability, see section Pinmuxing for details. Then connect the GPIO output pins to the controler inputs, a common ground and a power supply (5 V) as in the following wiring diagram
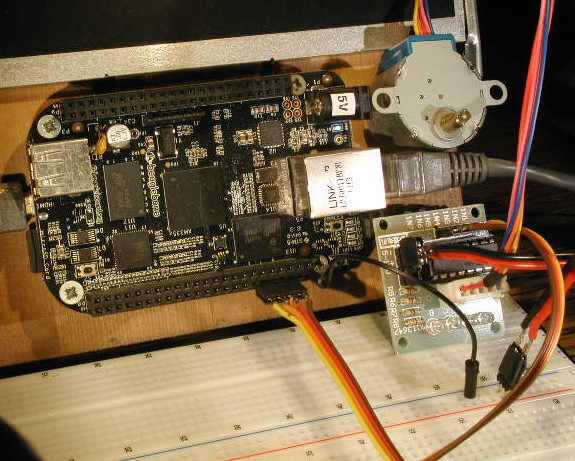
Here's a photo of such a setting
Operation:
Start the program by ./stepper and you'll see some information on how to control the motor
The last line gets updated continuously and shows the current state of the pins, the direction of the motor and the number of miliseconds the program waits before the next update of the output pins. The latest is equal to the speed of the motor, a high value (long sleep) represents a low speed. The speed range is form 1000 steps per second to two steps per second (sleep range 1 to 512). Direction can be either 1 for clockwise, -1 for counter clockwise or 0 for no rotation. The pins switch for half step movements, so you may see either one single or two pins at high state at a time.
While in example stepper the pins are set one after the other by function Gpio->setValue(), in the second example called stepper2 all pins get set simultaneously (all are set at the same time). Note the different pin set (P8_03, P8_04, P8_05, P8_06) used, since all pins have to be connected to the same GPIO-SS.
The C version shows (couldn't get ride of that green block under Key)
Source Code:
The examples in this section all produce grafic output. The source code is available only in FreeBASIC syntax (folder src/examples).
Description:
This example shows how to output a pulse width modulated (PWM) signal on some header pins and how to receive that signals as ADC input in IO mode. The code opens a grafic window and creates a new PruIo instance in IO mode for drawing continuously the sampled analog data from channels AIN-0 to AIN-2 (step 1 to 3) as line grafic with colored lines. By default it creates a full screen window without a frame. You can customize the window size by setting the size as command line option (ie. like ./pwm_io 640x100 for width = 640 and hight = 100).
You can manipulate the frequency and duty cycles of the signals and choose between drawing all inputs or just the manipulated one.
Preparation:
It needs some wiring to execute this example. The digital signals from the PWM pins (P9_14, P9_16 and P9_42) have to be connected to some analog inputs. Since PWM output is 3V3 and analog inputs are maximum 1V8, we need to transform the signals by voltage dividers. We use potentiometers (RV0, RV1 and RV2) for that purpose. The divider outputs get connected to the analog input pins (AIN-0 = P9_39, AIN-1 = P9_40 and AIN-2 = P9_37). The potentionmeters should be liniear and at least 1 k (47 k recommended). Make sure that the wipers are placed in a middle position before you connect the cables and switch on power.
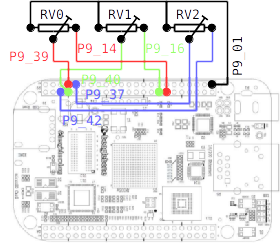
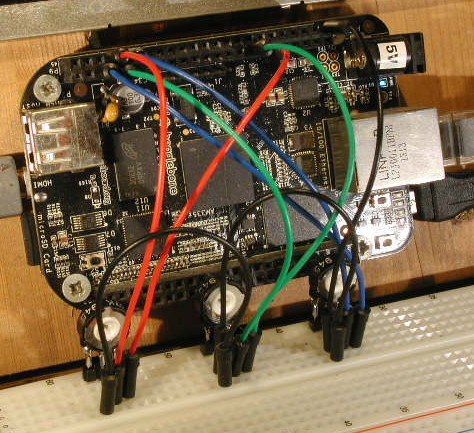
Here's a photo of such a setting. The colors of the cables (red = P9_14 / P9_39, green = P9_16 / P9_40 and blue = P9_42 / P9_37) correspond to the colors of the lines in the wiring diagram and the lines in the graphical window output of the example. Make sure to use high quality potentiometers and a reliable GND connection to avoid damaging the ADC subsystem by overvoltage.
The digital lines (P9_14, P9_16 and P9_42) need pinmuxing to operate in PWM mode. So you have to prepare your system for pinmuxing (see Section Pinmuxing).
Operation:
Execute the binary with a customized window size by
and you'll see a grafic window with three rectangle lines like

which is continuously up-dating the signals. (Adjust the potentiometers to see three lines at different hights, but avoid touching the upper border = overvoltage.)
The frequency and the duty cycle of each signal can get customized. The active channel (the one to edit) is shown in the window title (P9_42 at startup). To switch to another channel, use
| Key | Channel |
|---|---|
| A | P9_14 = PWMSS1-PWM-A |
| B | P9_16 = PWMSS1-PWM-B |
| C | P9_42 = PWMSS0-CAP |
To change the duty cycle, use
| Key | Duty |
|---|---|
| 0 | 0 % |
| 1 | 10 % |
| 2 | 20 % |
| 3 | 30 % |
| 4 | 40 % |
| 5 | 50 % |
| 6 | 60 % |
| 7 | 70 % |
| 8 | 80 % |
| 9 | 90 % |
| , | 100 % |
| . | 100 % |
To change the frequency (in the range of 0.5 Hz to 5.0 Hz), use
| Key | Function |
|---|---|
| + | increase frequency by 0.5 Hz |
| - | decrease frequency by 0.5 Hz |
| * | set frequency to 5.0 Hz |
| / | set frequency to 0.5 Hz |
Each of the above mentioned keys reduce the grafic to the active channel. To see all lines again, press
| Key | Function |
|---|---|
| Return | Make all channels active |
Any other key quits the program.
You can study the differences between the available PWM subsystems.
The blue line comes from an independend subsystem (PWMSS0-eCAP). Both parameters (frequency and duty) can get customzed without affecting the other channels. Any change becomes effective after the current period is finished.
In contrast, the other channels (red = P9_14 and green = P9_16) are both connected to the same subsystem (PWMSS1-eHRPWM). Both signals may have individual duties, but they always operate at the same frequency. A change of the duty becomes effective after the current period is finished. But a change of the frequency interrupts the current period and starts immediately a new period with the new settings on both channels.
Source Code:
Description:
This example shows how to sample ADC data. It creates a PruIo instance configured in IO mode and draws a continuously updated graph of the analog lines AIN-0 to AIN-7. The graph gets updated column by column by the currently sampled values. You can switch channels on or off to watch just a subset. By default it creates a full screen window without a frame. You can customize the window size by setting the size as command line option (ie. like ./oszi 640x400 for width = 640 and hight = 400).
Preparation:
No preparation is required. Optionaly you can connect the analog ground (AGND) and some of the analog input lines AIN-0 to AIN-6 to a voltage source in the range of 0 to 1V8 (ie. from a battery).
Operation:
Start the program by executing ./oszi 640x280 and you'll see a window like
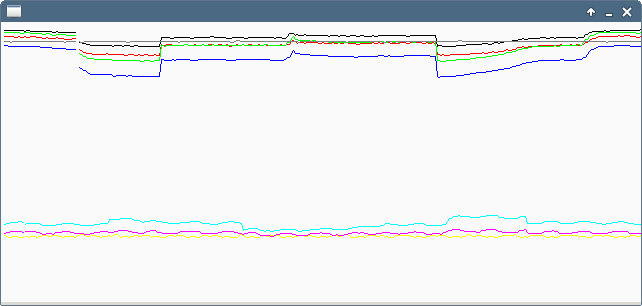
The grafic is scaled 0 V at the bottom and 1V8 at the top. You can toggle the channels on or off by pressing keys 0 to 7 (0 = AIN-0, ... 7 = AIN-7). The program prevents de-activating all channels (at least one channel stays active). Key '+' restores the default setting (all channels active). Any other key quits the program.
The less channels are activated, the faster the ADC subsystem samples the data. Ie. check it by connecting a constant frequency sine wave (0 to maximal 1V8) to any channel and switch off the others one by one.
Source Code:
Description:
This example shows how to sample ADC data in RB mode. It creates and configures a PruIo instance and draws a continuously updated graph of the analog lines AIN-4 and AIN-7. The graph gets updated in one step when one half of the ring buffer is filled. By default it creates a full screen window without a frame. You can customize the window size by setting the size as command line option (ie. like ./rb_oszi 640x400 for width = 640 and hight = 400).
Preparation:
No preparation is required. Optionaly you can connect the analog ground P_34 (AGND) and the analog input line AIN-4 to a voltage source in the range of 0 to 1V8 (ie. from a battery).
Operation:
Start the program by executing ./rb_oszi 640x280 and you'll see a window like
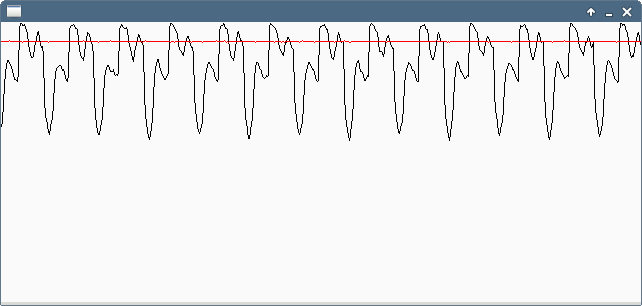
The grafic is scaled 0 V at the bottom and 1V8 at the top. Any keypress quits the program.
Source Code:
Description:
This example shows how to use triggers to start a measurement in MM mode and how to customize an ADC step (for the analog trigger 2). It opens a grafic window and creates a new PruIo instance for MM. By default it creates a full screen window without a frame. You can customize the window size by setting the size as command line option (ie. like ./triggers 640x400 for width = 640 and hight = 400).
The example offers to choose one of four different trigger types:
Preparation:
No pinmuxing is required, since the code uses P8_07 in its default configuration as digital input line (GPIO input with pullup resistor). To make a digital trigger event happen, you'll need at least a cable to ground that pin.
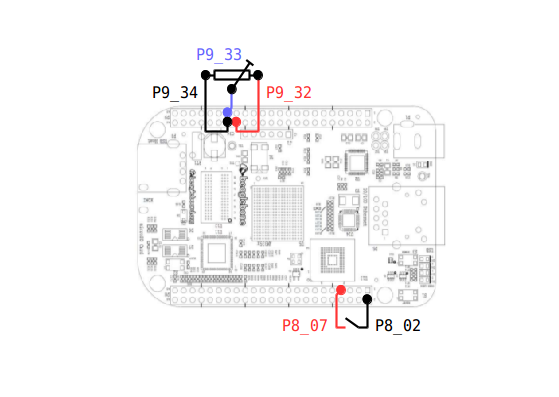
For analog triggers it is sufficient to handle the input signal (AIN-4) by a simple cable connected to header pin P9_33. The other end will get connected to either P9_32 (VADC) or P9_34 (AGND), depending on the choosen trigger event.
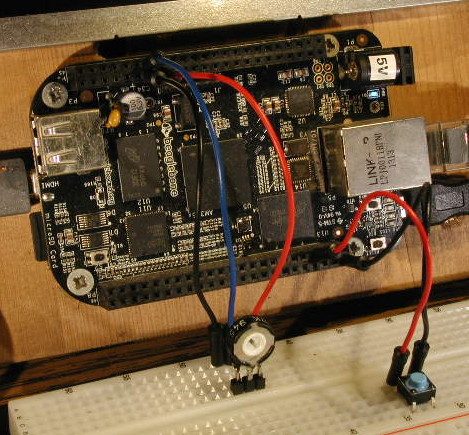
Instead of using simple cables, it's best to prepare a button for the digital trigger event and a variable resistor (5 k to 50 k) for the analog triggers as shown in the following figure
Here's a photo of such a setting
Operation:
First, execute the binary with a customized window size by
and you'll see the following menu in an empty grafic window.
The grafic is scaled 0 V at the bottom and 1V8 at the top. The sampling rate is 1 kHz. You can start a measurement of two channels (AIN-4 and AIN-7) immediately or by a trigger.
After choosing a trigger type (1 to 3), the program waits for the trigger event. Further keystrokes (other than 0 to 3) quit the program.
The next steps depend on the trigger to test:
0 = no trigger (start immediately)
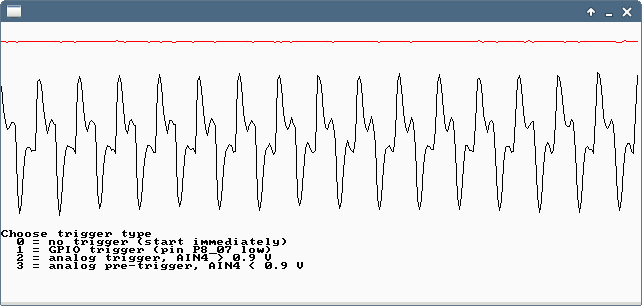
1 = GPIO trigger (pin P8_07)
You'll see a window like following (some input on AIN-4 here)
2 = analog trigger (AIN-4 > 0V9)
Adjust the variable resistor to the P9_32 side. After you reached the middle position, you'll see a window like the following (here AIN-4 signal is generated manually by the potentiometer)
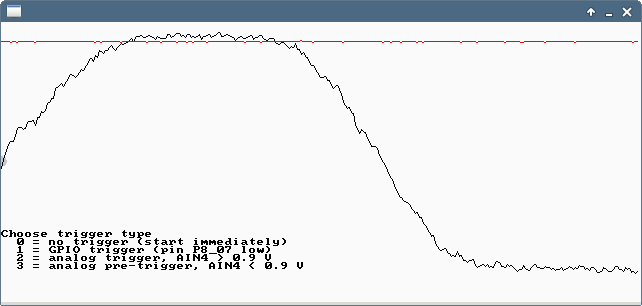
Black = AIN-4 starts on the left side in the middle of the window hight (the trigger event) and shows any signal. Red = AIN-7 (board voltage = 1V65) is always at the top of the window. The menu showns up again for the next test.
In case of no potentiometer, release the cable. The channel AIN-7 will pull up the open trigger channel AIN-4 to a voltage above the trigger voltage. (If this doesn't happen, connect the cable between P9_32 (VADC) and P9_33 (AIN-4).)
3 = analog pre-trigger (any AIN < 0V9)
Adjust the variable resistor to the other side. After you reached the middle position, you'll see a window like the following (here AIN-4 signal is generated manually by the potentiometer)
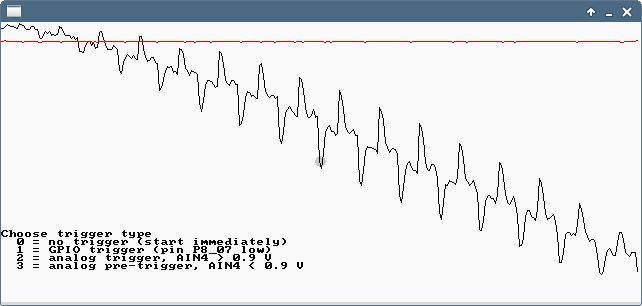
Black = AIN-4 starts on the left side in the upper part of the window and passes through the middle (the trigger event). Red = AIN-7 (board voltage = 1V65) is always at the top of the window.
When any analog line is below 0V9 at the start of the trigger, you'll see a window like
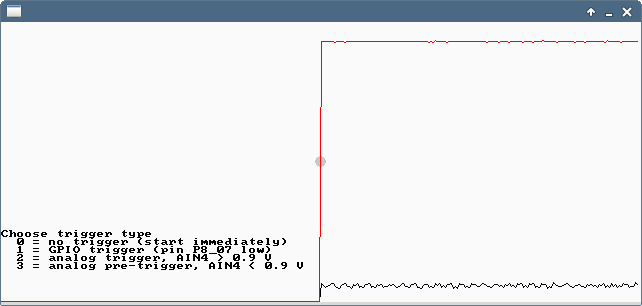
Here no pre-trigger samples are available (since the measurement starts immediately) and these samples get set to 0 (zero).
In case of no potentionmeter, release the cable. The open trigger channel AIN-4 starts to swing below the trigger voltage. (If this doesn't happen, connect the cable between P9_34 (AGND) and P9_33 (AIN-4).)
Source Code: