| GooData Reference Manual | ||||
|---|---|---|---|---|
| Top | Description | Object Hierarchy | Implemented Interfaces | Properties | ||||
GooBar2dGooBar2d — bar chart (scaled by a GooAxis). |
 |
struct GooBar2d; struct GooBar2dClass; GooBar2d * goo_bar2d_new (,GooCanvasItem *ParentGooAxis *Axis,GooDataPoints *Dat,...);
"channels"gchar : Read / Write "filler"gpointer : Read / Write "gaps"gchar : Read / Write
GooBar2d is a subclass of goo_canvas_item_raise()goo_canvas_item_rotate()
To create a GooBar2d use goo_bar2d_new().
All bar charts can be orientated in horizontal or vertical direction
depending on the axis used for scaling. A vertical axis (ie GOO_AXIS_WEST
or GOO_AXIS_EAST) causes bars in vertical direction.
The GooBar2d group contains these childs:
a
a
GooBar2d * goo_bar2d_new (,GooCanvasItem *ParentGooAxis *Axis,GooDataPoints *Dat,...);
Create a new bar chart item from values in Dat. By default channel 0
(zero) is used. Specify an alternative set of channels by "channels".
Each row gets a set of bars in a different color generated by goo_color_function()
|
the parent item, or NULLg_object_unref() |
|
the axis to scale the values |
|
the data values to draw with |
|
optional pairs of property names and values, and a terminating NULL |
Returns : |
a new bar item. [transfer full] |
Since 0.0
"channels" property"channels"gchar : Read / Write
The type of the bar graph and the channels (columns) in the Dat array
for the values of the bars.
This may contain
no value to use the default channel (= 0). Example "" or NULL
one or more values to set channels for a standard graph with one bar for each column starting at zero in a group and one group per row. Example: "7 9".
the start letter 'C' and two or more values to draw a standard graph with bars starting at the value of the first channel (instead fo zero). Example: "c 4 1 7 9" to read the start value from channel 4; bars are drawn from channels 1, 7 and 9 goes to the value of channel 4.
the start letter 'A' and two or more values to let the bars of a standard graph start at the avarage of the values of the given channels in a row. Example: "a 1 2 3" to draw bars from the avarage of channel 1, 2 and 3 to the values of channel 1, 2 and 3.
the start letter 'G' and two or more values to draw a Gantt chart. The given channel specifies the width of the bar, the start value gets red from the previous channel. Example: "g 1" draws a bar of the length of channel 1 with the start position from channel 0. Additional channels will be drawn in the same row. Bars with a length of zero will be skipped.
the start letter 'P' and two or more values to draw a chart of stacked bars, scaled to percentage values. Each bar stack goes from zero to 100 and is separated into colored areas depending on the channel values. Only positive values are valid (and negative values are scaled by -1). Example: "P 4 5 6" to stack the percentage values of channels 4, 5 and 6.
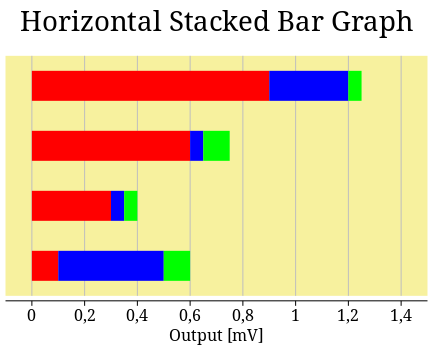
the start letter 'S' and two or more values to draw a chart of stacked bars. Only positive values are valid (and negative values are scaled by -1). The bar starts at zero and each channel value creates a bar on top of the previous. Example: "S 4 7 2" to stack the values from channel 4, 7 and 2 (latest on top).
the start letter 'V' to set an offset value and two or more channel numbers to draw a standard graph ...
When a channel number is greater than the number of columns in Dat
no bar graph will be drawn.
Default value: NULL
Since 0.0
"filler" property"filler"gpointer : Read / Write
The filler object to set color/pattern/pixbuf for bars.
"gaps" property"gaps"gchar : Read / Write
The gaps between the bars of the graph as percentage of the width. The first value is the space between the bar groups (related to the graph width) and the second value is the space between the bars (related to the individual bar width).
By default the bars are set with 10 percent space between each group. So if just one channel is choosen the bars will cover 90 percent of the available space and between each bar a gap of 10 percent of the bar width is free. If more than one channel is choosen, then by default the individual bars of one row are set in a group side by side without space between them and the 10 precent space is between the bar-groups of one row.
The range of the values is from 0 to 50 percent. Negative values are scaled by -1 first, then values greater 50 are reduced to 50 percent.
This may contain
no value to use default gaps. Example "" or NULL
one value to set group gaps. Example: "25" for 25 percent space between the groups. ("0" for no spacing at all.)
two values to set group gaps and individual gaps. Example: "0 20" for no group spacing but 20 percent space between each individual bar.
Note: the border line width needs some space if NULL
Note: in case of stacked graphs ("channels" with start letter 'G', 'P' or 'S') the second value gets ignored.
Default value: NULL
Since 0.0